Search


What is Cost of Carry? Meaning, Formula and Role in Futures Pricing
 260
260
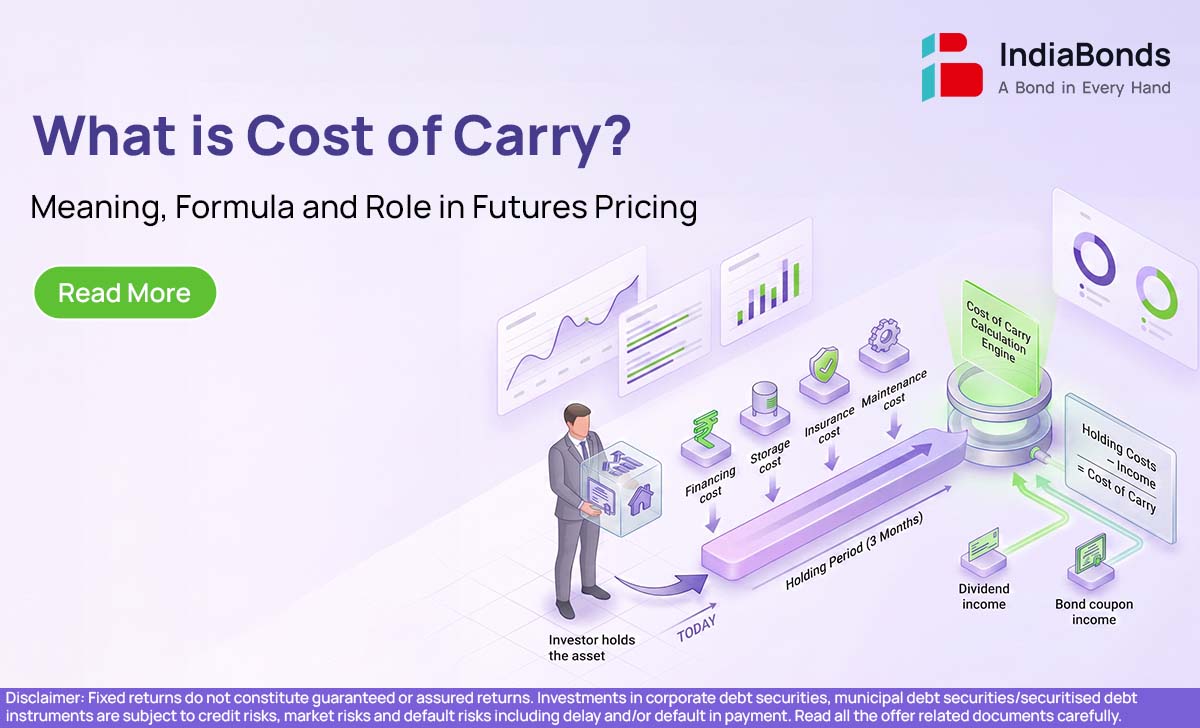
Buying an asset is not always the only expense involved in holding it. The owner may also pay interest, storage charges, insurance or other costs until the asset is sold. Together, these expenses are known as the Cost of Carry. The concept is especially useful for understanding why the futures price of an asset may differ from its current spot price.
Key Takeaways
- Cost of carry is the net expense of holding an asset for a period.
- It may include financing, storage and insurance costs.
- Income earned from the asset reduces its net carrying cost.
- Cost of carry influences the relationship between spot and futures prices.
- Different assets have different carrying-cost components.
- Futures prices usually move closer to spot prices as expiry approaches.
Definition of Cost of Carry
The Cost of Carry definition refers to the total net cost involved in purchasing and holding an asset until a future date.
Suppose an investor buys an asset today instead of agreeing to buy it three months later. The investor may need to arrange funds for the purchase. During those three months, there may also be storage, insurance and maintenance expenses.
At the same time, the asset may produce some income. A share may pay a dividend, while a bond may make a coupon payment. Such income reduces the net cost of holding it.
Therefore, the Cost of Carry meaning is not limited to one expense. It is the difference between the costs of holding an asset and the benefits or income received during the same period. CME describes carrying charges for physical commodities as storage, insurance and financing expenses.




What is the Cost of Carry Model?
The cost of carry model explains the connection between an asset’s spot price and its expected futures price.
A person can gain future exposure to an asset in two broad ways. The first option is to purchase the asset today and hold it. The second is to enter into a futures contract for delivery at a later date.
The model assumes that the prices of these two routes should remain reasonably connected. Otherwise, traders may try to benefit from the difference by buying through the cheaper route and selling through the more expensive one.
The model considers:
- the current spot price;
- the cost of financing the purchase;
- storage and insurance expenses;
- income received from the asset;
- the benefit of physically holding the asset; and
- the time remaining until the futures contract expires.
For assets that can be purchased and stored easily, carrying costs are commonly reflected in the gap between their spot and futures prices.
What is Cost of Carry Futures?
Cost of Carry Futures refers to the carrying expenses and benefits built into the price of a futures contract.
Consider a commodity that costs $10,000 in the spot market. A buyer planning to hold it for six months may face financing, storage and insurance expenses. If these costs add up to $400, the six-month futures price may be close to $10,400, assuming there is no income or other benefit from holding the commodity.
This difference does not mean that the seller is simply adding a profit margin. It represents the economic cost of holding and delivering the asset at a later date.
The futures price may be higher than the spot price when carrying costs are positive. This market condition is commonly called contango.
However, futures may sometimes trade below spot prices. This can happen when the immediate availability of the asset is valuable or when the income and benefits from holding it are greater than its carrying expenses.
Cost of carry differs across markets:
- Commodities: Storage, insurance and financing are important.
- Shares: Financing cost and expected dividends matter.
- Bonds: Funding cost and coupon income affect carry.
- Currencies: The interest-rate difference between two currencies influences forward and futures pricing.
CME explains that financing costs are embedded in futures prices and that cost-of-carry considerations affect the difference between spot and futures values.
Cost of Carry Formula
A simplified Cost of Carry Formula is:
Cost of Carry = Financing Cost + Storage and Other Holding Costs – Income Earned
The related futures-pricing formula can be written as:
Futures Price = Spot Price + Cost of Carry
This simple version is useful for basic understanding. A more detailed continuously compounded model is:
F = S × e^[(r + u − y) × T]
Where:
- F is the theoretical futures price;
- S is the current spot price;
- r is the financing or risk-free interest rate;
- u represents storage and other holding costs;
- y represents income or convenience yield;
- T is the time until expiry; and
- e is the mathematical constant used for continuous compounding.
For a share or equity index that pays dividends, the model may be written as:
F = S × e^[(r − q) × T]
Here, q represents the expected dividend yield.
Income reduces the futures price because a person holding the actual asset may receive that income, while the futures-contract holder generally does not receive it before expiry.
NSE uses cost-of-financing inputs when calculating theoretical settlement prices for unexpired futures contracts where the required market price is unavailable.
How to Calculate Cost of Carry?
Suppose an asset costs $10,000 and will be held for one year. The financing cost is 6%, storage and insurance together cost $200, and the asset produces income of $100.
The calculation will be:
Financing cost = $10,000 × 6% = $600
Cost of Carry = $600 + $200 – $100 = $700
The estimated futures price under the simple model will be:
$10,000 + $700 = $10,700
This is a theoretical value. The actual market price may differ because of demand, supply, liquidity, transaction costs and changing expectations.
What is Cost of Carry in Derivatives?
Cost of Carry in Derivatives helps explain how forward and futures contracts are priced in relation to the underlying asset.
A futures trader usually does not receive a separate bill for storage or financing. Instead, the market builds the net carrying cost into the contract price. When carry is positive, a longer-dated futures contract may trade above the spot price. When the benefits of holding the asset are greater, the contract may trade below spot.
The relationship also influences the basis, which is the difference between the spot and futures prices. As the contract approaches expiry, the two prices generally move closer because little or no carrying period remains. Cost-of-carry differences are therefore an important part of derivatives pricing and arbitrage analysis.
Conclusion
Cost of carry is the net expense of owning an asset until a future date. It includes financing and holding costs after adjusting for income or benefits. The concept helps explain the gap between spot and futures prices. However, the formula provides a theoretical value. Actual prices can still move with market demand, liquidity, risk and expectations.
FAQs in Brief
What Is the Impact of Cost of Carry on Financial Markets?
Cost of carry influences futures and forward pricing. A higher financing or storage cost can push the theoretical futures price above the spot price. Dividends, coupon income and other benefits can reduce that difference.
Where Does Cost of Carry Fit in Future Derivative Pricing?
It connects the current spot price with the value of delivery at a later date. The futures price generally reflects the spot price plus net carrying costs for the remaining contract period.
What Cost of Carry Factors Should an Investor Account for?
An investor should consider borrowing costs, storage, insurance, expected income, dividends, coupons, contract tenure, transaction charges and any benefit from physically owning the asset.
Who pays the cost of carry?
The person physically holding the asset directly bears expenses such as financing, storage and insurance. In the futures market, these costs are generally reflected in the contract price rather than collected as a separate payment.
How do you calculate carry cost?
The basic calculation is:
Carry Cost = Financing Cost + Holding Expenses – Income or Benefits
The amount can then be added to the spot price to estimate a theoretical futures price.
Disclaimer : Fixed returns do not constitute guaranteed or assured returns. Investments in corporate debt securities, municipal debt securities/securitised debt instruments are subject to credit risks, market risks and default risks including delay and/or default in payment. Read all the offer related documents carefully.
260