

Download IndiaBonds App


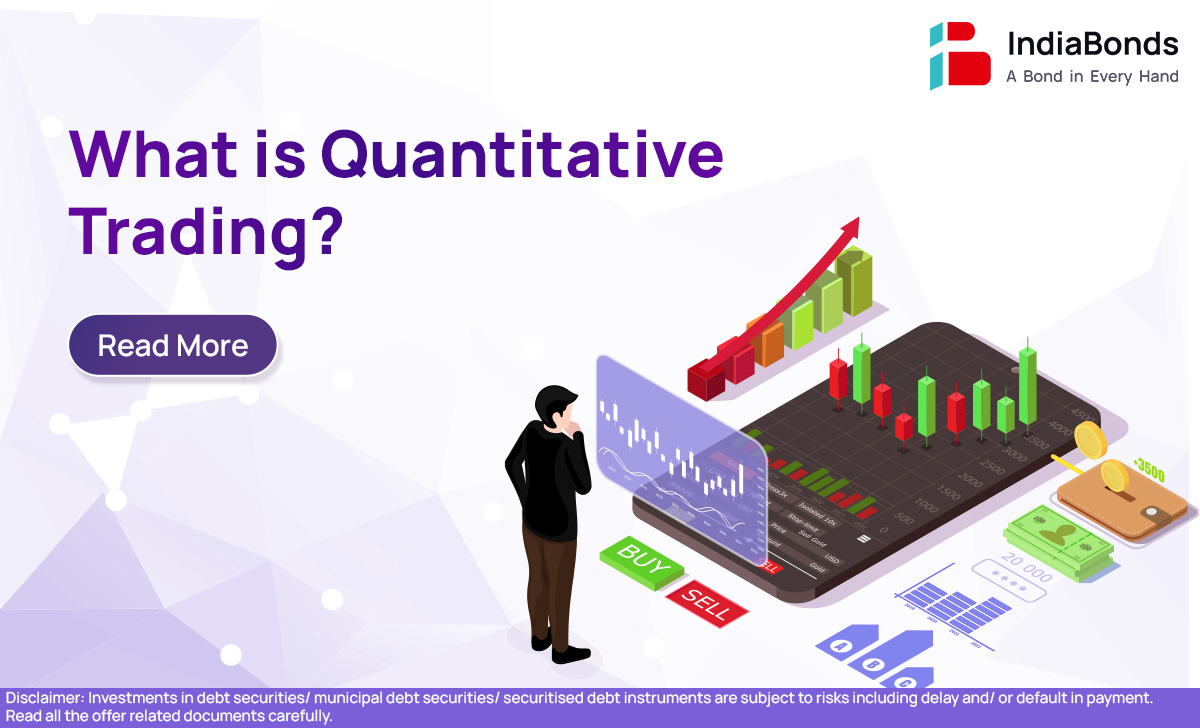
What is Quantitative Trading?
 447
447
Ever watched your neighbor make money in the stock market while you’re losing your shirt? Yeah, me too. Turns out, some people aren’t just lucky – they’re using math to beat the market. Crazy, right?
Introduction
What is quantitative trading? It’s basically letting numbers make your trading decisions instead of your emotions. You know how you panic-sell when stocks drop or buy high because everyone’s talking about a “hot stock”? Well, quantitative trading throws all that out the window.
Think of it this way: instead of playing poker with your feelings, you’re playing with a calculator. The computer looks at tons of data, finds patterns, and tells you when to buy or sell. No more staying up at night wondering if you made the right call.
My buddy Steve tried to day trade for two years. Lost about $15,000 because he kept buying high and selling low. Then he discovered quantitative trading. Now he just lets his computer do the work while he watches Netflix. Smart guy.
Essential Quantitative Metrics for Traders
Okay, don’t let the fancy words scare you. These metrics are just ways to measure if you’re doing well or badly.
The Sharpe ratio is like asking “Am I making enough money for how risky this is?” If you’re barely making more than a savings account but your investments are jumping around like a kangaroo, that’s a bad Sharpe ratio.
Maximum drawdown is simpler – it’s the biggest loss you might face. Like, if your $10,000 drops to $7,000, that’s a 30% drawdown. You want to know this before it happens, trust me.
Volatility just means “how crazy does this investment get?” Some stocks are boring (good for sleeping at night), others are like riding a roller coaster blindfolded. Pick your poison.
Using Statistical Models to Identify Market Trends
Here’s where it gets fun. Statistical models are like having a really smart friend who notices stuff you don’t.
Moving averages are dead simple. If a stock usually trades around $50, but suddenly it’s at $40, that might be a buying opportunity. Or if it’s at $60, maybe it’s time to sell. The computer tracks this stuff automatically.
Mean reversion is my favorite because it makes sense. Things that go way up usually come back down. Things that crash usually bounce back. It’s like gravity for stock prices.
I remember my first mean reversion trade. Tesla had dropped 15% in three days for no real reason. My algorithm said “buy,” so I did. Made $800 in two weeks when it bounced back. Felt like a genius, but really it was just math.
Machine Learning in Quantitative Analysis
This sounds super technical, but it’s not that complicated. Machine learning is like having a computer that gets smarter over time. It looks at millions of trades and figures out what works.
The cool part about quantitative analysis in stock market stuff is that computers can spot patterns humans miss. Like, maybe every time oil prices go up, certain airline stocks drop three days later. You’d never notice that, but a computer would.
There are quantitative trading platforms now that do this for regular people. You don’t need to be a rocket scientist anymore. It’s like having a professional trader in your pocket, except it doesn’t need coffee breaks.
Backtesting and Optimization Techniques
Before you risk real money, you test your idea on old data. It’s like practicing free throws before the big game.
I learned this the hard way. Had a “brilliant” strategy that would’ve doubled my money last year. Problem was, it only worked during good markets. When I tested it against 2008 data, it lost 60%. Ouch.
Good quantitative strategies work in different market conditions. Bull markets, bear markets, sideways markets – your system should handle all of them. Or at least you should know when to turn it off and wait things out.
Incorporating Quantitative Methods into Trading
So how do you actually start? Baby steps, my friend.
First, don’t bet your kid’s college fund on your first algorithm. Start with money you can afford to lose. Maybe $1,000 or $2,000. Think of it as paying for an education.
Paper trading is perfect for beginners. You trade with fake money but real market data. All the learning, none of the crying. I paper traded for six months before risking real cash.
Diversification is key too. Don’t put all your money in one quantitative trading strategy. Spread it around like you’re trying different restaurants – some will be great, some will give you food poisoning.
FAQ
What does a quantitative trader do?
They build math-based systems to trade automatically. Instead of watching CNBC all day and making gut decisions, they create algorithms that buy and sell based on data. It’s like being a mechanic, but for trading strategies.
What is an example of a quantitative trade?
Here’s a simple one: Every time Amazon drops more than 3% in a day for no obvious reason, buy it. Hold for a week, then sell. The computer does this automatically. No emotions, no second-guessing. Just math.
Is quantitative trading profitable?
It can be, but it’s not magic money. The big Wall Street firms use quantitative analysis stocks because it works over time. But you still need good strategies, and you’ll still have losing days. It’s just more consistent than gambling on hunches.
What is the salary of a quantitative trader?
At big firms, newbies might make $100,000-$200,000. The really good ones make millions. But most independent traders make normal middle-class money. Don’t quit your day job expecting to get rich quick.
Look, quantitative trading isn’t going to make you the next Warren Buffett overnight. But if you’re tired of losing money on emotional decisions, it’s worth learning about. The best part? You can start small, learn as you go, and actually sleep at night knowing a computer is watching your investments.
Just remember – even the smartest algorithm can’t predict the future. But it can help you make better decisions based on what’s actually happening, not what you hope will happen. And honestly? That’s already a huge advantage over most people.
Disclaimer : Investments in debt securities/ municipal debt securities/ securitised debt instruments are subject to risks including delay and/ or default in payment. Read all the offer related documents carefully.
447


CIN: U67100MH2008PTC178990
SEBI Registration No.: INZ000311637
NSE Member ID - Debt Segment: 90316
BSE Member ID - Debt Segment: 6811
Caution : Beware of fraudsters and impersonators misusing the name of IndiaBonds. Always verify communications and transactions through our official website www.indiabonds.com and mobile application only. Click here for Advisory and Safety Tips.