


Total Outstanding Bonds in India
 6.17K
6.17K

Bonds are fixed income instruments whereby the issuer borrows money from the investor and pays interest on the loan until maturity where the entire amount is repaid. India’s bond market plays a crucial role in channeling funds and facilitating investment opportunities in the entire economy of the country. As of 31st March 2026, the total outstanding bonds in India amounted to an impressive $2.76 trillion. This article delves into the components of the bond market representing the distribution of these bonds, shedding light on the various types and their respective contributions to the Indian debt market.
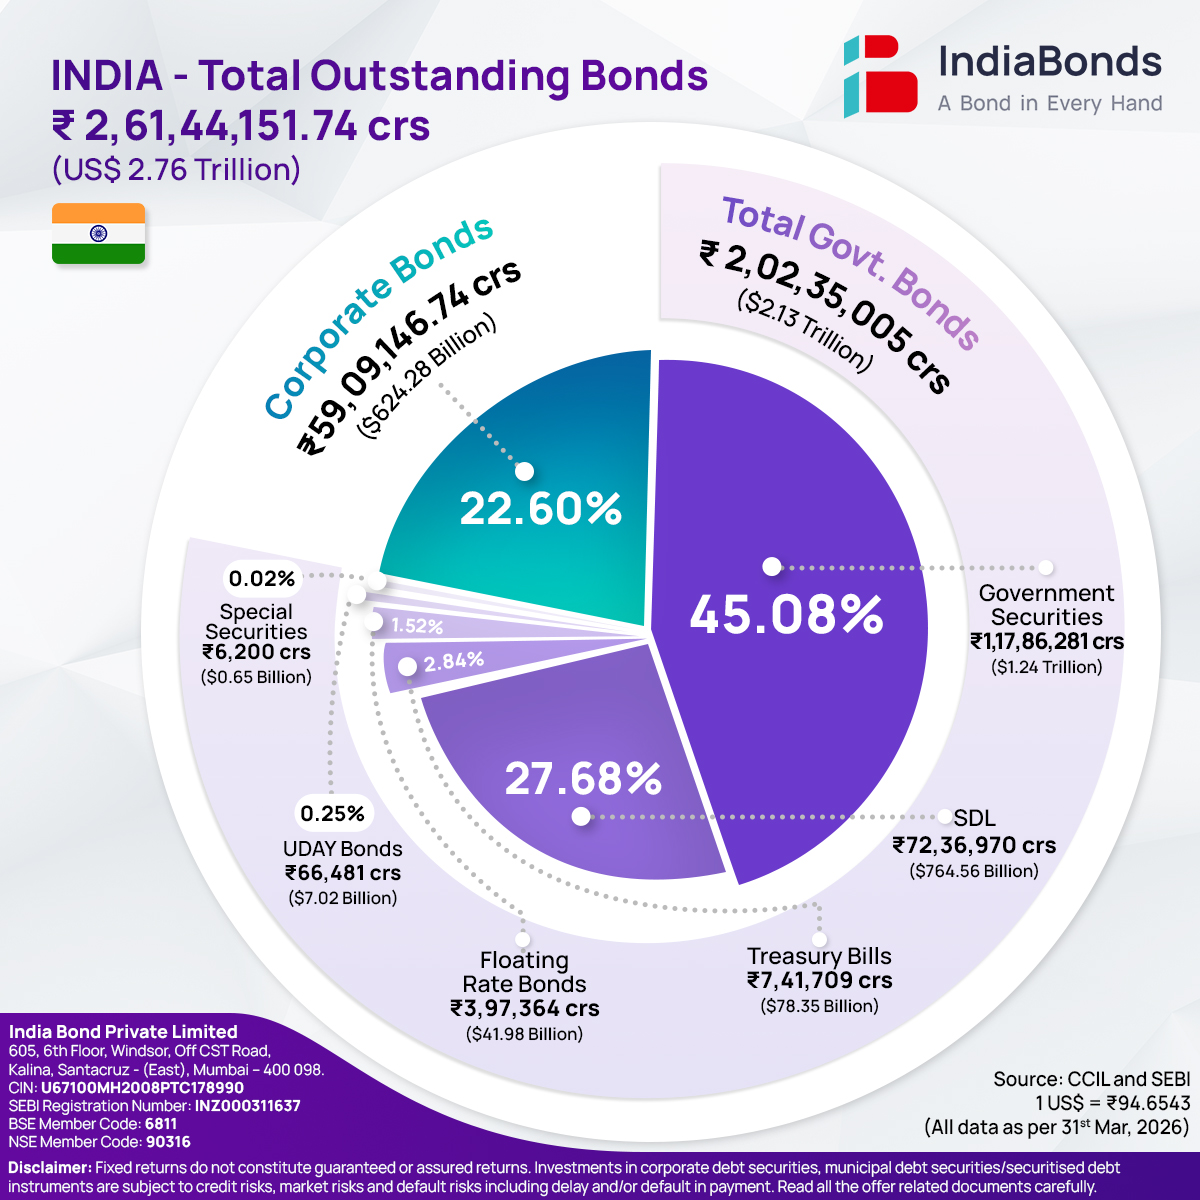
Government Securities – $1.24 trillion (45.08%)
Government Securities (G-Secs) are issued by the Reserve Bank of India (RBI) on behalf of the central government. These instruments play a pivotal role in fiscal requirements and used for investment/development by the government which contributes to growth of the economy. Government Securities occupy the largest share of the pie chart, accounting for 45.08% of the total outstanding bonds. Known for their low-risk nature, government securities provide investors with a highest level of security compared to other types of bonds. They serve as a reliable investment option backed by the unwavering faith and creditworthiness of the government.
State Development Loans (SDLs) – $764.56 billion (27.68%)
State Development Loans (SDL) are issued by the central government on behalf of the states in India to meet their funding needs. Hence, they carry a guarantee from the central government for interest and principal payment. SDLs comprise 27.68% of total outstanding bonds in the pie chart. These loans are an important source of financing for various developmental projects undertaken at the state level. SDLs offer investors an opportunity to participate in regional economic growth while still enjoying a reasonable level of security.
Treasury bills – $78.35 billion (2.84%)
Treasury bills (T-bills) contribute 2.84% to the total outstanding bonds. These short-term debt instruments, issued by the central government, serve as a means to fulfill immediate funding requirements. T-bills are highly liquid and provide investors with a secure avenue to park surplus funds for short durations. They are popular among institutional investors, banks, and individuals seeking stability and liquidity in their investments.


Floating Rate Bonds – $41.98 billion (1.52%)
Floating Rate Bonds, issued by the central government, hold a share of 1.52% in the pie chart. These bonds have interest rates that adjust periodically based on a reference rate or a specific benchmark. Floating rate bonds provide investors with protection against rising interest rates and offer the potential for higher returns compared to fixed-rate bonds in a rising rate environment.
UDAY Bonds – $7.02 billion (0.25%)
The Ujwal DISCOM Assurance Yojana (UDAY) Bonds were introduced to help financially distressed power distribution companies (DISCOMs) in India and represent 0.25% of the total outstanding bonds. UDAY bonds were issued by the central government and aim to improve the financial health of DISCOMs by restructuring their debt and addressing operational inefficiencies. Investing in UDAY bonds allows investors to support the revival of the power sector while potentially earning attractive returns.
Special Securities – $0.65 billion (0.02%)
Special Securities also known as oil bonds, fertilizer bonds, and food bonds, are issued to entities such as Oil Marketing Companies, Fertilizer Companies and the Food Corporation of India contributes 0.02% to the pie chart. These securities serve as compensation for these companies instead of cash subsidies. They typically offer a slightly higher coupon rate compared to other securities and have a longer maturity period. Special Securities provide targeted investment opportunities for investors looking to align their investments with specific government initiatives and policies.
Corporate Bonds – $624.28 billion (22.60%)
Corporate Bonds occupy a significant portion of the pie chart, accounting for 22.60% of the total outstanding bonds. These bonds are issued by corporations such as Public Sector Undertakings (PSUs), banks, state guaranteed corporations, private companies etc. to secure capital for their business operations. While corporate bonds may entail greater risk due to the creditworthiness of the issuing company, they offer the potential for higher returns compared to government bonds. Corporate bonds provide investors with tailored investment options, including various maturities, coupon rates and credit ratings. It is important to note the credit ratings for these bonds as it signifies the financial credit worthiness of the issuer. In the investment grade spectrum, AAA ratings demonstrate the highest safety down to BBB- ratings which are deemed to carry considerable amount of risk.
Conclusion
The composition of India’s outstanding bonds reflects the diversity and potential within the Indian debt market. The total outstanding government bonds dominate the market by a whopping $2.76 trillion (77.36%), offering investors a low-risk investment avenue. Additionally, treasury bills, floating rate bonds, UDAY bonds, special securities and corporate bonds provide opportunities for investors to align their investments with specific financial goals and risk appetites. Understanding the composition of outstanding bonds empowers investors to make informed investment decisions and capitalize on the various opportunities presented by India’s thriving debt market.
Disclaimer: Investments in debt securities/ municipal debt securities/ securitised debt instruments are subject to risks including delay and/ or default in payment. Read all the offer related documents carefully.
6.17K


